/data/universe/

Steal Like an Artist

Austin Kleon‘s book Steal Like an Artist is short but rich with ideas for anyone nurturing creative projects.

All of the sections are thought-provoking, but I especially appreciated the suggestion to work offline more, with tangible, physical materials.  I’ve broken out of many mental blocks by turning away from the computer screen to scribble on a blank sheet of paper.   Kleon even suggests having separate analog and digital desks.

He’s not against the Internet, though, pointing out that it’s the best place in the world to get inspiration: by following the people whose work most impresses you, you fertilize your own ideas.  And sharing your own work there starts a virtuous feedback loop.

Originally a blog post, but much more satisfying expanded as a physical book.

How to Recruit Harvard Grads Away from Goldman Sachs

A number of recent articles have returned to the question of why such a high proportion of graduates from elite U.S. colleges take jobs in management consulting and investment banking.  (When I graduated from Harvard in 2005, it was nearly 50% of the class; today it’s more like 30%.)  The general consensus of these writers is that this allocation of the supposed best and brightest (and certainly most advantaged) young people is bad for society.  It diverts smart, motivated people from potential careers in science, engineering, politics and government, the military, public interest work, the academy, and entrepreneurship.  Why do so many Ivy Leaguers choose consulting and banking jobs right out of college?  Surely high school seniors don’t chose Yale with the dream of becoming an analyst at a investment bank four years later.

Several explanations are commonly offered, all plausible.  I will argue—by comparison with another common postgraduate path, Teach for America—that banking and consulting firms use specific, highly successful recruiting tactics that can be adapted by other employers.

1.  The most straightforward argument is economic: blame the invisible hand of the market.   Investment banking and consulting are so much more remunerative than any other entry-level job that it would be irrational for students to choose other jobs. (Total compensation for first-year banking analysts is well north of $100k.)  In The Trap, Daniel Brook argues that elite students are increasingly driven to choose high-wage jobs due to their rising indebtedness (due to tuition increases) and the high cost of living in cities (as rising income inequality prices out those without corporate jobs).  (In the 1970s New York City schoolteachers and investment bankers had similar starting salaries!)

However, the salary argument has difficulty accounting for the recruiting success of a surprisingly similar program: Teach for America.  TfA sends a significant fraction of the graduates of these same schools off to teach in inner city schools for two years at low wages; 17% of Harvard seniors applied in 2010.  Some wage premium might be expected in selling out and working for the Man, and I suspect few Ivy grads would sign up for TfA if the tour were indefinite in duration, but here is an example of graduates choosing against their naked economic self-interest.

2.  The second explanation blames the colleges: today’s graduates have no marketable skills!  Four years of fancy schooling, and they have no real-world experience to convince an employer to hire them.  In this view, consulting and banking firms take these unpolished diamonds and give them a real education, spinning them off in a few years to go make a difference in a field of their choosing.

If these graduates have so few skills, though, why do these firms (and by extension their clients) pay them such high salaries?  And why do they recruit entirely from elite schools?  Further, while analyst jobs provide exposure to business culture and reasoning, much of the actual entry-level work is jockeying Excel and Powerpoint files–not exactly tasks requiring sophisticated technical training.  In the case of TfA,  even fewer concrete skills are transferable to a non-teaching context.

3.  The final explanation, voiced by recent grads as well as David Brooks, looks to the psychology of the students.  In this scenario, students are hugely uncertain how to choose a career and don’t have firm values or goals to guide them.  They’re probably also overcommitted with other activities and have little time for reflection.  Therefore, they fall back on the pattern that got them where they are: looking for the next prestigious competition to enter and winThe commonality of TfA with banking and consulting thus becomes clear: they are highly selective programs that recruit heavily.  With a well-defined recruiting process, they provide a way to defer the question of what’s next for a few years while earning a good salary and gaining business experience.  (In the TfA case, the promise is of making a difference through service, proving that the rewards need not be financial.)

I think all three explanations are valid, but my own experience leads me to weight the third most heavily.  Law and grad schools are populated in similar ways, although decreasing demand for lawyers and the overproduction of PhDs make these poorer choices.  (Medical school is somewhat the opposite, demanding singleminded focus during the undergraduate years in exchange for near-guaranteed employment if one is admitted to and survives med school and beyond.)

While the aggregate career choices of elite grads may be a failure requiring correction, I suggest that it also represents an opportunity:  The TfA example suggests that an organization can gain access to a pool of the best and brightest with smart recruiting.  With the post-crash backlash against investment banking and the general downsizing of the financial sector, now is a good time to recruit at the most selective schools.

What are the recruiting strategies used by these companies?

  • Prestige–some aspect of the job which can be bragged about to peers and parents, whether money or interesting work or social impact.
  • Selectivity and exclusivity–competition for scarce slots makes the job seem valuable and getting an offer an achievement.
  • Short-term commitment–jobs are presented as something one does for a few years before moving on with new skills, lessening commitment anxiety.
  • Personal recruiting and networking–recent grads come back to describe the work, giving individual students ego-boosting attention and providing social proof that the career path is a good one.
  • A well-defined timeline–recruiting season happens in the fall, so students can try it out “just in case” and get job offers well before the looming uncertainty of graduation.

Already, the technology sector is taking pages from this playbook.  Startup incubators like Y-Combinator provide structure, competition, prestige, and the promise of a big payday, pulling in former consultants and bankers as well as new grads.  A new data science fellowship is trying to intercept PhD scientists turning off the academic track.

I even think PhD programs could benefit from this approach.  While grad school has long been a refuge for those uncertain of their next step, the cost in lost opportunities to students spending five to seven years earning a PhD which won’t land them a permanent academic position is significant.  What if we acknowledged this from the beginning, and positioned grad school as training for a wide variety of careers?  The allure of scientific discovery would remain a draw, but schools could recruit based on expanding valuable technical skills and encourage more direct interaction with industry.  Time to degree would probably be shortened, lessening the commitment.  Professional science masters programs are a step in this direction.

How Big is the Market for Big Data?

I am bullish on the potential of increasingly pervasive data storage and analysis (one sense of “Big Data”) to improve outcomes in business, government, education, and our personal lives.  The cost of storage is plummeting (though providing useful access to that data has a nontrivial cost).  Faster computers, better algorithms, and increasingly experienced data scientists are arriving to take advantage of the bounty.  Even small gains in efficiency can be valuable for large industries, and Kaggle has repeatedly shown that modern machine learning can beat industry benchmarks.

This author provides a skeptical take on the size of the analytics market, though, highlighting a range of assumptions which may not hold:

The basic hypothesis goes like this: ‘It’s becoming ever cheaper to collect and store data due to ever increasing networking, new database structures and rapidly falling data storage costs. Companies are collecting mountains of data. Now they want to extract value from all this data they have, but don’t know how to do it. Companies that help them extract the insights will be well rewarded.

There are a number of sub-hypotheses. A) This data collection is a recent phenomenon B) Value is not already being extracted from whatever data is being collected C) Companies will need outside help to extract insights D) Outsiders can help companies extract insights without having deep industry knowledge E) The insights gathered from ever larger data sets have more value and are more accurate than insights gathered from smaller data sets F) Unstructured and cross functional data have huge value waiting to be extracted.

Notably, Netflix never implemented the million-dollar algorithm that won the Netflix Prize, as the cost of implementation didn’t justify the improvements over the intermediate results from the competition.

The history of artificial intelligence research is filled with boom and bust periods driven by the hype cycle.  Ultimately, measurement and quantitative assessment are vital to achieving the ends we desire–but let’s not overpromise the potential returns of Big Data.

Update: Other skeptical reactions on Hacker News.

Arguing to the Algorithm: Machine-Learned Scoring of Student Essays

This week marks the end of the Kaggle Automated Essay Scoring Competition.  I participated as a way to build my machine learning skills after learning the basics in Andrew Ng’s online class.

The goal of the competition was to develop algorithms that could automatically score student essays for standardized achievement tests.  Kaggle (and the sponsoring Hewitt Foundation) provided thousands of student responses and scores for eight essay prompts in a variety of formats.  After the competition, the organizers will compare the best results to the predictions of several commercial grading packages.

Optimizing machine learning algorithms is challenging, as there is a great deal of freedom in constructing them.  One must first choose and extract the best numerical features from the text. In this case, these may range from simple counts of the number of words in the essay or the number of misspellings to sophisticated measures of semantic similarity.  Next, one must select the best algorithms with which to model the features (Linear Regression and its variants, Neural Networks, Support Vector Machines, Random Forests, Gradient Boosting…).  Many of these algorithms require tuning to achieve the best performance.  Finally, one may use a variety of ensemble methods to blend the results of multiple algorithms in order to obtain optimal predictions.

Given this complexity, I didn’t have great expectations for my results in my first real machine learning task.  My performance was decent; I placed 19th in the final standings.1  Our results were scored with a measure called “Quadratic Weighted Kappa” which assesses the consistency of the grades assigned by two different raters.  A score of zero indicates only chance agreement of the scores, while 1 would indicate perfect agreement.  My best scores averaged over all eight essays were about 0.74, while the highest scoring submissions are around 0.80.

By far, the most predictive feature was essay length:  The number of characters was 64% of the weight of my Random Forest classifier, followed by Determiner (DT) parts of speech (12%), misspelled words (11%), the number of words (3.5%), and comparative adjectives (JJR) (1.4%).  Everything else was below 1%. 2

Audrey Watters wrote a post about the contest and included a link to the paper (Shermis & Hamner 2012) assessing the performance of commercial vendors on this dataset.  Surprisingly, four out of nine of the commercial vendors scored worse than I did!  My score was also right about at the level of consistency human raters have with each other–0.75.  The best commercial scores were 0.77 and 0.79, so it looks like the Kaggle winner will have beaten all the commercial packages.

It’s extremely interesting that these algorithms can be as consistent with human raters as humans are with each other despite not “reading” the essays in a way comparable to human reading.


While participating in this competition has been an interesting and challenging learning experience, I can’t help but have reservations about the use of algorithmic essay grading in education.3  (Inside Higher Education quotes Shermis arguing that automated graders could be a useful supplement in entry-level writing classrooms.)

The standardized testing paradigm is indicative of modern education’s roots in the Industrial Revolution–students as standardized widgets.  Writing to please an algorithm seems especially dehumanizing, though, and there’s no learning happening here.  The black box spits out a score, providing no feedback a student could use to improve their logic, use of evidence, rhetoric, grammar, usage, style–in short, any of the things we value in writing. 4 A teacher individually engaging with a student and her writing over a period of time is still the best way to improve reasoning and its expression.

Moreover, because the algorithms are trained on a representative sample of essays, automated essay scoring necessarily devalues idiosyncratic or creative responses.  Can you imagine how an algorithm would score an essay by Emily Dickinson (improper punctuation use) or Ernest Hemingway (short, simple sentences)?

To be clear, I appreciate the value of these tools.  You can’t improve student learning if you don’t measure it, and human graders are costly, cursory readers.  But I think there’s a direct analogy between automated essay grading and standardized testing itself.  In both cases, you’re trying to assess the quality of a multifaceted entity (the essay or the individual) in terms of measurable quantities.  The temptation is to conflate measurability with importance.

As Shermis & Hamner themselves write,

A predictive model may do a good job of matching human scoring behavior, but do this by means of features and methods which do not bear any plausible relationship to the competencies and construct that the item aims to assess.   To the extent that such models are used, this will limit the validity argument for the assessment as a whole.

Assessments have real-world consequences.  When an algorithm becomes the measure of quality of an essay, or a standardized test determines the classes a student can take or the university she attends, correlation becomes causation.  Longer essays score higher, and students who score better on tests have better opportunities.

Instead of sorting students along arbitrary scales, I think we’d be better served by trying to maximize the unique potential of each individual.


For fun, I fed this blog entry into my essay scoring model.  Despite having nothing to do with the essay prompts, it earned scores ranging from 64% to a whopping 95% of the maximum, with a mean of 82%.

The New Online Education

This year has been momentous for online education, with first Stanford and now MIT offering free online courses designed for the web.  Taking a number of cues from the Khan Academy, these courses are different from previous online offerings.  They are free to take and have no admissions requirement, in contrast to online classes provided by colleges and universities which are part of standard degree programs.  However, unlike the free course materials often posted online, these courses are designed for the web from the start to take advantage of the strengths of the medium.  They are starting to define a new web pedagogy.

This fall, I took Andrew Ng’s online Machine Learning course.   The course units were divided into short video lectures (8-15 minutes each), each of which had an ungraded review question to check comprehension.  Each unit ended with graded review questions, and in the advanced track there were weekly programming exercises that were graded electronically.

For my purposes, the course was a complete success.  While the online version had somewhat less topical coverage and rigor than the offline version it was based on, I now feel confident that I can undertake machine learning projects and learn more as needed, building on the fundamentals of the course.

These new online courses are designed from the start to scale.  All grading is done electronically, so there is little difference for the instructors between teaching ten students and ten million.  Since the lectures are prerecorded and short, students can watch them on their own schedule, fitting them around work or family obligations.  However, the class is not completely asynchronous.  Weekly deadlines encourage one to remain caught up and engaged.  Help is provided student-to-student in course forums online and self-organized real-life meetup groups, so enforcing a schedule creates a cohort which can tutor itself.

What are the implications of these courses for higher education in general?  It’s difficult to say.  To some degree, these courses function as branding for the exclusive universities that offer them, providing a taste of elite education without the potential of a diploma that would really open doors.  It is clear that these universities won’t undercut themselves and dilute their prestige with these offerings; they’re unlikely to offer online equivalents of their law or business curricula, for instance.

It’s tempting to think that widespread use of these courses would encourage hiring based on demonstrated skills, no matter how attained.  It’s possible, though, that they will feed a new credentialism as schools monetize these online offerings by selling certifications for completing a block of courses in a topical area.  (“I have a Stanford Certificate in Big Data Learning for Social Marketing Entrepreneurship!”)

One particular advantage of these courses is their potential for unique offerings.  With a global audience, courses too specialized or unusual to have large enrollments at any specific school could reach many interested students.

No matter their effect on higher education, in the near term these courses represent a remarkable opportunity for self-motivated independent learners to pick up new skills and broaden their education.  Great universities have always shared their knowledge broadly; the web may further democratize this outreach.

The Best Books I Read in 2011

For the last few years, I’ve kept a simple text log with some brief notes summarizing the books I read.  It’s been satisfying watching the list grow, and I am able to give much better answers when friends ask me what I’ve been reading lately!

Mining that list, here are the best books I read this year.  It was a good year for me–roughly half of what I read gets an enthusiastic recommendation.  Not all of these books were released this year, of course; getting a popular book out of the Berkeley Public Library hold queue requires patience!

The Paradox of Choice: Why More is Less
Barry Schwartz
This wise overview of the psychological research shows that we make worse choices and are less happy with the outcome when we try to make the best possible choice among many options.  “Satisficing”–settling for good enough–gives better results.

The Personal MBA
Josh Kaufman
A decent introduction to fundamental business concepts, distilled from the pop business literature.  Its easy reading stems from its origins in the author’s blog.

Where Good Ideas Come from: The Natural History of Innovation
Steven Johnson
Helpful reading for anyone trying to push the boundaries of what’s possible, this book shows the similarities between evolution in nature and the evolution of new ideas.

In the Plex: How Google Thinks, Works, and Shapes Our Lives
Steven Levy
A detailed history of Google from an excellent technology writer (Levy’s Hackers is an fascinating account of the early PC era).

One Less Car: Bicycling and the Politics of Automobility
Zack Furness
Historical perspective on the contentious relationship between cyclists and automobile drivers.

The Rider
Tim Krabbe
Justifiably classic, this work of fiction follows an amateur cyclist through the course of a long road race.

The Trap: Selling Out to Stay Afloat in Winner-Take-All America
Daniel Brook
Explores how increasing income differentials between corporate and non-corporate work, rising student loan debts, health insurance challenges, and decreased support for public primary education constrain the career choices of well-educated young people.  Not the last word on this subject, surely, but a useful addition to the discussion of financial inequality.

Boomerang: Travels in the New Third World
Michael Lewis
Not my favorite Lewis book, but an entertaining perspective on the world’s current financial insanity.  The differences in how the credit boom and bust played out in different countries are remarkable.  The chapters were published as articles in Vanity Fair.

The Emperor of All Maladies: A Biography of Cancer
Siddhartha Mukherjee
A masterful, erudite, and deeply humane history of cancer and our attempts to overcome it.  Richly woven with historical and scientific detail, but still a page-turner.  A winner of the Pulitzer Prize, it transcends technical writing to become literature.

Limitation

All human activities are subject to limits.  Economic or technological trends determine the futures of jobs and businesses.  Weather shapes agricultural yields.  In athletics, the strength of an opponent’s or of one’s own body are decisive.  Creativity, inspiration, and influence play roles in art and literature.  Political progress requires coalition-building and persuasion.  Some of these forces which create contingency may be resisted; others not.

Astronomy also operates within limits.  Budgets and telescope time are finite.  But the practice of astronomy also involves confronting more fundamental limits, those set by nature itself.

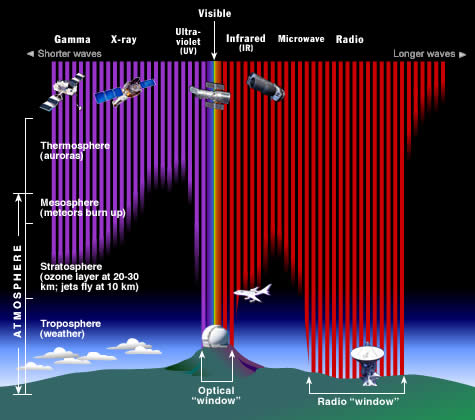
Atmospheric absorption as a function of wavelength

Atmospheric absorption as a function of wavelength (NASA)

Astronomers observe the light emitted by sources at all wavelengths, from long, slow radio waves up to gamma-rays so energetic that their photons can be counted one by one.  The Earth’s atmosphere absorbs light differently at different wavelengths.  Thus, an astronomer studying supernovae in visible light travels to a dark mountaintop for clearer skies.  A radio astronomer listening for ET or timing a pulsar can stay at ground level, but her array of dishes will be far from the electromagnetic noise of cities.  Scientists building instruments to observe the X-rays and gamma-rays emitted by black holes or neutron stars will go to deserted locales to launch balloons and rockets.  The wispy particles called neutrinos emitted by the sun must be observed underground in mines!

Our tools, too, are limited: some by expense or electronics, but others by basic properties of geometric optics or semiconductor detector physics.

I’d like to think that this daily, personal, bodily encounter with fundamental boundaries encourages a respect for external reality.  For those who might think truth only an opinion, the universe offers ready reminders of its laws.  Perspective, and a little humility, are some of science’s most valuable results.

A Role for Public Data Competitions in Scientific Research?

The public data challenge has emerged as one response to the need for sophisticated data analysis in many sectors.  The prototypical example of these competitions is the Netflix Prize, which awarded $1M for improved predictions of user movie ratings1.

Kaggle provides a platform for organizations to sponsor their own challenges.  The most high-profile is currently the $3M Heritage Health Prize; participants are asked to predict hospital admission rates from previous insurance claims.  Other competitions have focused on freeway travel time, the success of grant applications, and the progression of HIV infection.

One challenge caught my attention because of its astronomical content.  The Mapping Dark Matter challenge asks participants to predict the shape of simulated galaxies.  The scientific motivation for this measurement is a better understanding of dark matter.  While dark matter can’t be observed directly because does not emit light, the gravitational pull it exerts will bend light, causing small distortions in the observed shape of background galaxies.  A large statistical sampling of these distortions will constrain the dark matter distribution.

Unfortunately, the dark matter signal is much smaller than other distortions created when the data are recorded.  The Earth’s atmosphere and the telescope optics create blurring effects, and the data are pixellated when they are stored on the detector.  The Kaggle challenge (and related GREAT10 competition for astronomers) is to find an algorithm which will best infer the true ellipticity of the galaxy from the observed, noisy data.

Diagram of effects distorting galaxy shapes in observed images (courtesy GREAT competition).

I was initially skeptical that this challenge would yield improved results.  While many of the other crowdsourcing challenges were proposed by organizations unlikely to have many data science experts on staff, the professional astronomers proposing this competition are highly trained mathematically and have expert domain knowledge.  Moreover, I didn’t expect that the small prize (travel to an astronomical conference to present the results) would motivate many participants.

However, as of this writing 45 teams have joined the competition, submitting hundreds of attempts.  Already, participants have improved significantly on the benchmark results provided by the organizers, and the challenge will continue for another month.  One of the leaders is a PhD student who has employed techniques from his field of glaciology in the image analysis.  This success prompted a press release from the White House.

Why was this competition, with its small prize, successful in beating the efforts of numerate experts?  Psychological research has shown that monetary incentives are quite poor at motivating creative breakthroughs.  Instead, the potential for recognition, autonomy, and mastery are better motivators.  By satisfying these drives, crowdsourcing competitions provide means to access the cognitive surplus of skilled technical people at a cost far below the true value of their labor.  Moreover, by expanding the field of participants beyond professional astronomers, the challenge increases the cross section of the “adjacent possible,” described by Stephen Johnson as a key driver of innovation.  In this case, the familiarity of the Kaggle participants with machine learning approaches enabled a larger solution space compared to the imaging analysis approach favored by astronomers2.

What lessons can we draw to encourage the success of future scientific crowdsourcing competitions?  First, the major problem to be solved was one where the scientists themselves were not experts.  In this case, the problem was algorithmic, but others could be related to computation, statistics, or engineering.  Second, the challenge was designed to allow low barriers to entry.  The scientists abstracted the problem sufficiently to remove the requirement for specialized domain knowledge.  Finally, the challenge was structured to enable clear, quantitative judgement of the success of proposed solutions.

Crowdsourcing challenges can provide new approaches to thorny technical problems in scientific research.  Funding agencies may not wish to allot grant funds for prize money, but even modest monetary rewards can elicit valuable participation.

Visualizing Social Networks III: Twitter

Part 3 of 3.  Return to Part 2.

The Twitter network differs from Facebook and LinkedIn because it does not  require relationships to be reciprocal.  Accordingly, I can follow users whose updates I find interesting or valuable without any expectation that they will do the same.  (In network parlance, this creates a “directed” graph, in contrast with undirected graphs with symmetric links between members.)  Twitter’s structure enables efficient one-to-many broadcasting (@ladygaga and @justinbieber have more than ten million followers each), fueling its growth as a platform for breaking news.

I started using Twitter only earlier this year.  Since I get updates about my real-world friends through Facebook, the network of people I follow on Twitter is essentially a map of my interests.  It’s an incomplete interest graph, as key players in many fields outside of the Twitter triumvirate (tech, news, celebrities) don’t use it as a channel for sharing new information.

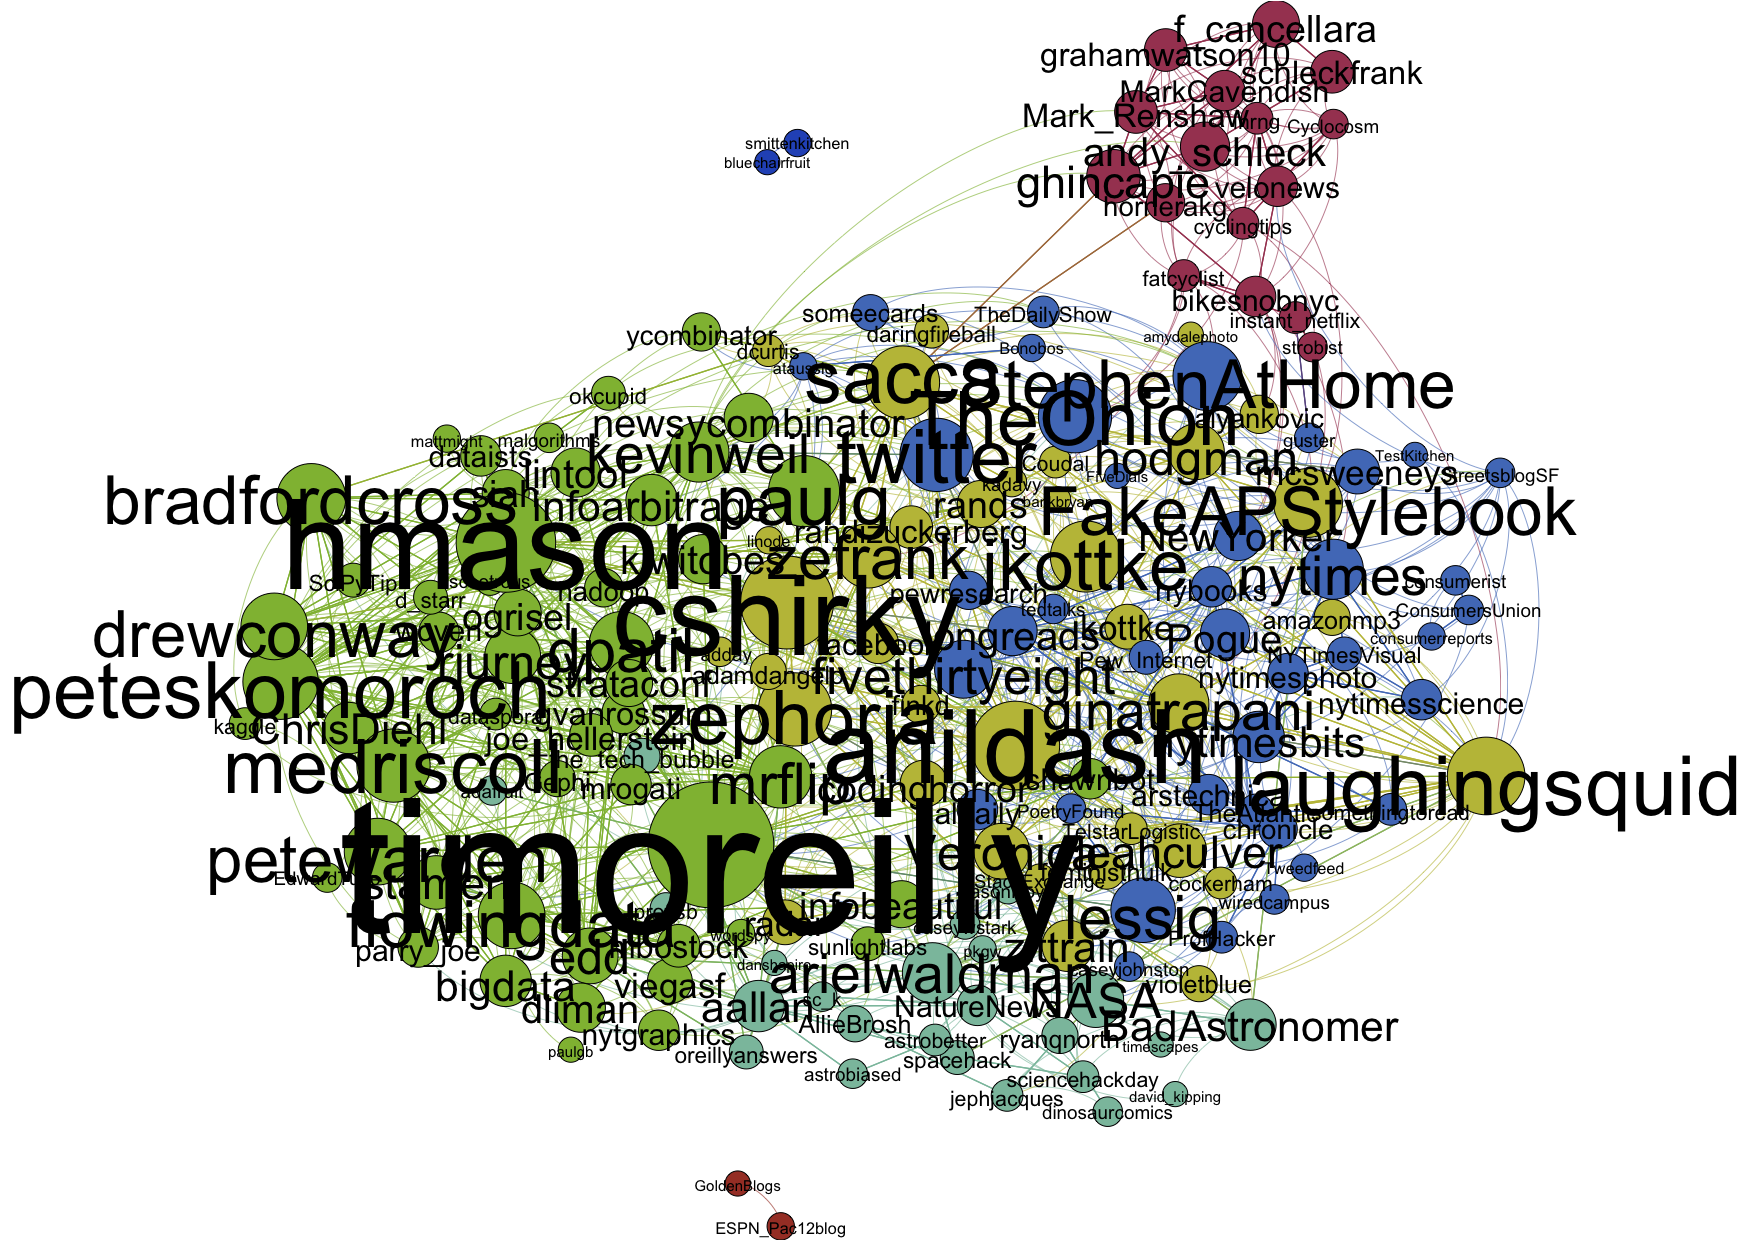
Extracting follower information from Twitter requires a bit of effort, starting with creating a registered OAuth application.  However, the API provides access to network information for all (non-protected) users.  I combined the excellent code of Drew Conway and Edd Dumbill to build connections among people I follow.  The resulting Gephi plot follows (large png; pdf).  Since these connection data are public, I’ve included the usernames1.

Since this is a directed graph, I’ve plotted one-way relationships with curved lines and mutual connections with straight lines.  The size of the node and the username indicate the relative number of followers of the user within this network.   Publisher Tim O’Reilly (@timoreilly) stands out as a major influence on this crowd.

Again, I’ve used Gephi’s modularity routines to locate and color different communities.   I’d identify them as follows:  data science (green), general tech (yellow), general news (blue), astronomy and webcomics (teal), and pro cycling (maroon).  The two disconnected components are food and Cal football.

While Gephi identifies the topical communities within this network, what strikes me is how compact the network is compared to that of my Facebook friends2.  Geography and time constrain real-world friendships, while ideas and influence can flow freely through Twitter.  The challenge is to extract meaningful signal from the stream using one’s finite attention3.

Visualizing Social Networks II: Facebook

Part 2 of 3.  Return to Part 1.

As with LinkedIn, the graph of friendships in Facebook generally corresponds to relationships established in the real world.  Due in part to its more broad-based entertainment appeal, Facebook presently has about six times more registered and active users.

I joined Facebook in early 2004 while I was in college, and over time membership (if not regular participation) on the site has become essentially universal among people of my age cohort.  The network graph accordingly provides an excellent mapping of the offline social networks I participated in at these times.  However, my Facebook friendships generally do not include some important communities, particularly my family and my work colleagues.  While many of these people now have Facebook accounts, Facebook friendship has not been a natural outgrowth of these relationships.

Facebook doesn’t provide a native tool like LinkedIn’s InMaps to plot friend networks, and no third-party applications are particularly popular.  Instead, I used the Facebook plugin netvizz to export my data and plotted it myself using Gephi.  (This presentation provides instructions if you’d like to do so yourself.)

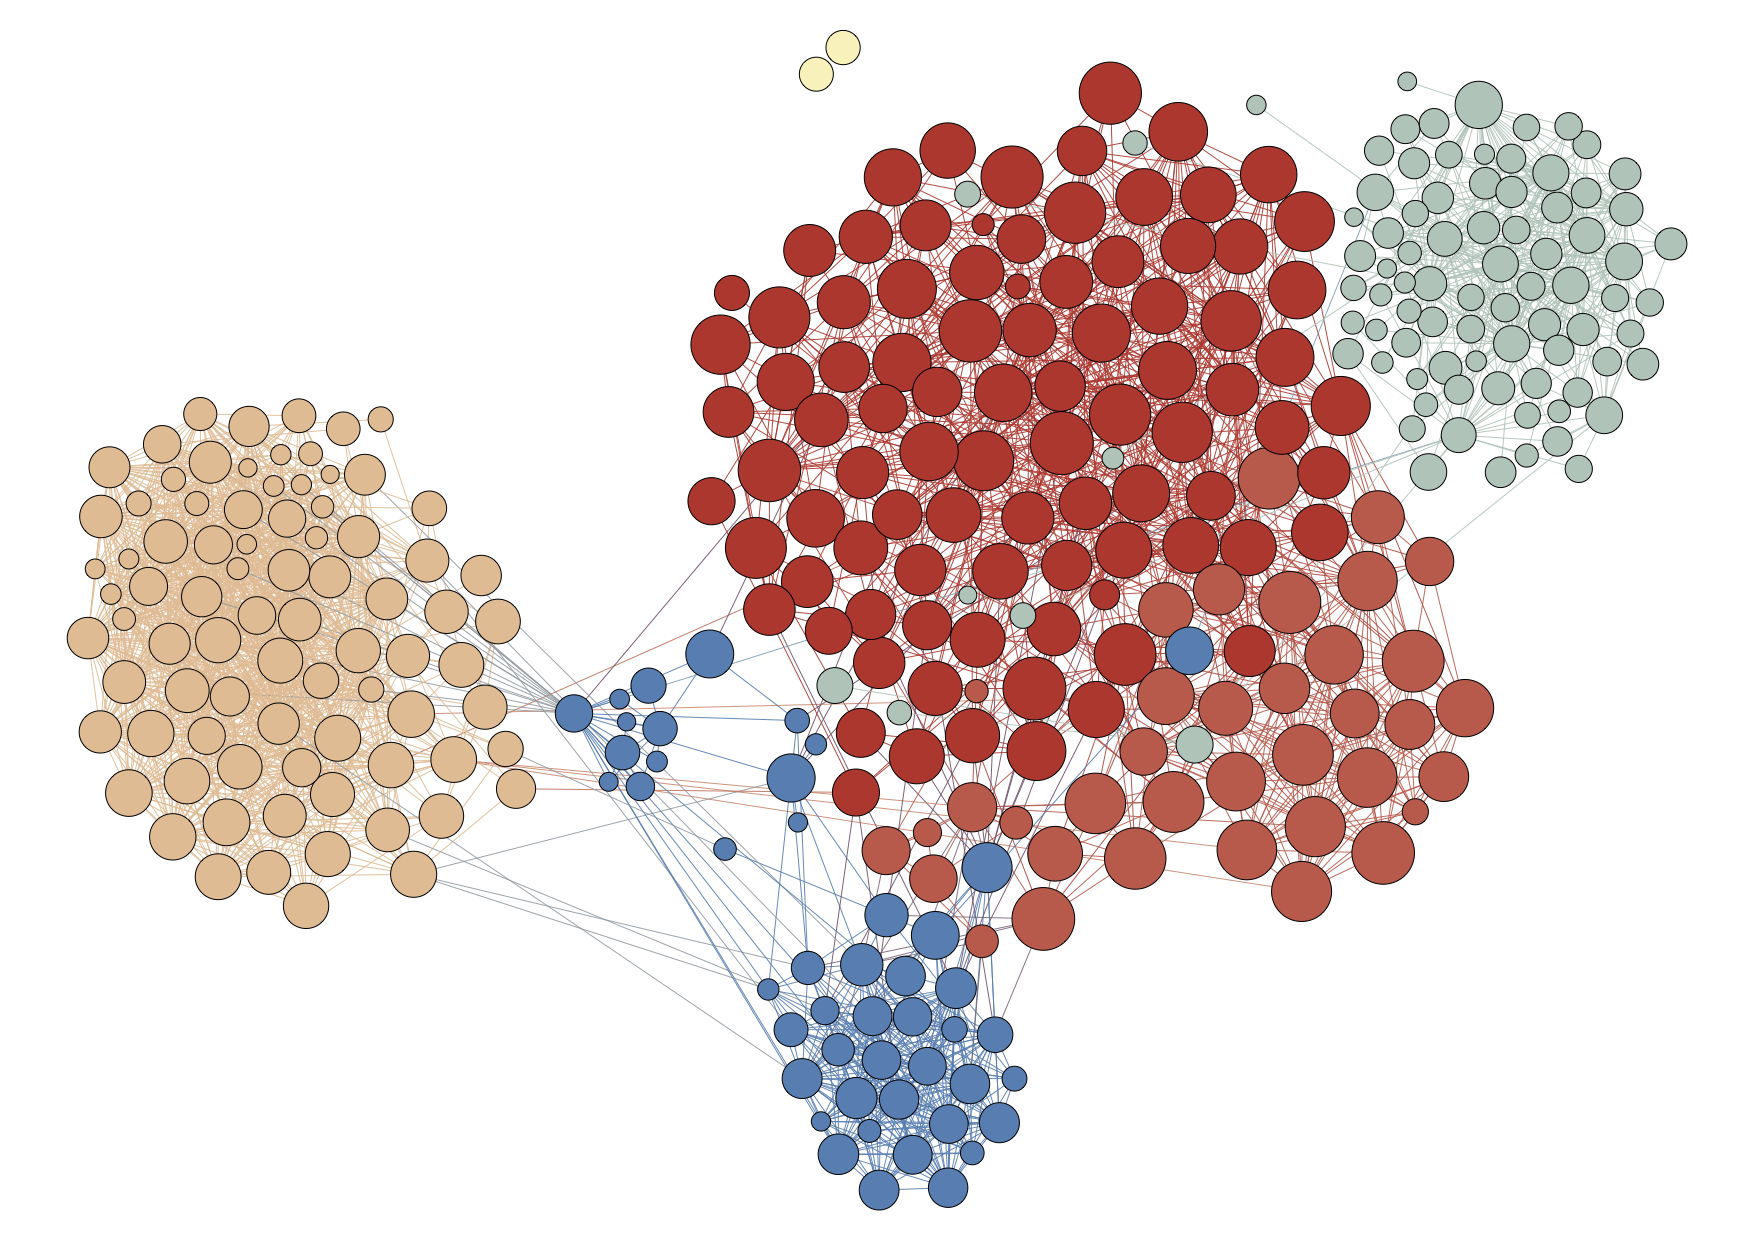
In this first plot (large png; pdf), I’ve used Gephi’s Force Atlas layout algorithm to pull together those friends who are most tightly connected through mutual friendships.  This functions to reveal sub-communities within the network.  I’ve also used Gephi’s modularity function to attempt to identify and color these cliques.

While I have not plotted the names for privacy reasons, Gephi quite accurately detects the communities here.  Red points are my college friends; red-orange are from a college club.  Green points are high school friends, hometown folks, and family.  Blue points are grad school classmates, and peach are members of a grad school club.

The size of the nodes in this plot scale with the age of the account; as expected, my college friends (red) have the oldest accounts, while the newest accounts are generally hometown/family (green).

Note that while I have not plotted my own node here–since I’m by definition connected to everyone–the vast majority of my friends have other friends in common.  (A pair of friends from a summer program form a separate subgraph, and I’ve omitted the few people who are only connected to me.)  The mathematical description known as “betweenness centrality” describes how likely a given friend is to connect two other friends by the shortest path on the network.  Another measure, the degree of any given node, specifies how many total friends that person has in the network.

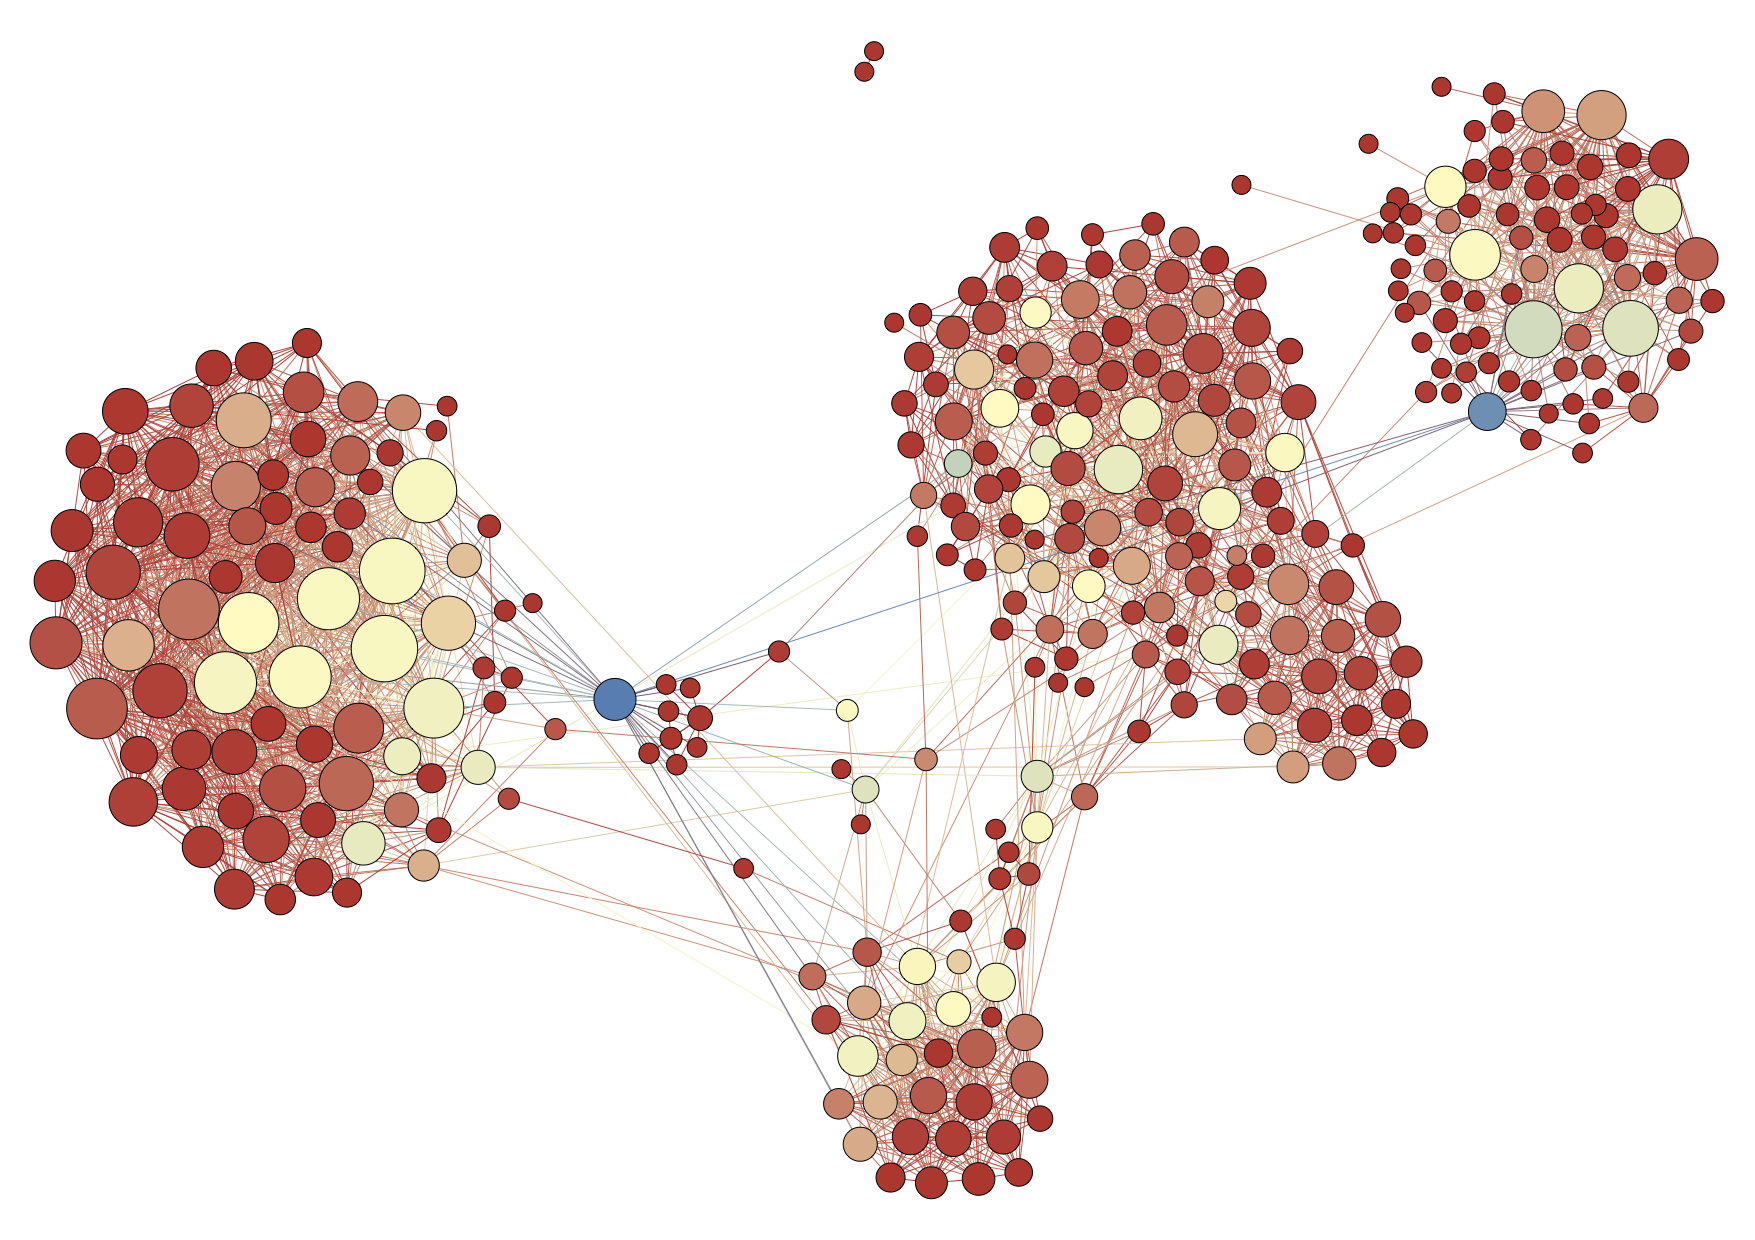
I plot these values in a second plot (large png; pdf) below, where the size of the nodes now corresponds to degree and the color to betweenness.

Underlining the distinct separation between the communities, the highest-degree nodes are central to certain cliques–e.g., the officers of the grad-school club.  (Degree is thus correlated with closeness.)  Two individuals (in blue) are the most significant in terms of betweenness: my fiancée and my younger brother, who connect my grad school circles to my hometown.  A few other green individuals can be identified as casual friends who have moved between cliques, particularly from college to grad school.

Basic graph analysis on real-world social network data can thus identify key individuals and communities.  Note that the dataset that Facebook itself has is far richer, containing records of interactions (photo tags, wall posts, comments, etc.) which may be used to trace the strength of a relationship through time.

Continue to Part 3.